In this article, I will share how tracing and more specifically Jaeger tracing can fit into your wider software observability strategy.
Before we get into tracing, let’s define observability.
What is observability?
Observability is a comprehensive means of gaining data on how software services perform in production.
This data gives you a picture of the health and performance of individual services, as well as the cloud infrastructure that supports them.
It can be broken down into 3 actions: logging, tracing, and monitoring. Our focus in this article will be on tracing.
What is tracing?
Tracing is an action that tracks a request from initiation to completion within a microservices architecture.
It usually starts when a user or service starts a request which moves along a chain of interconnected services needed to fulfill the request.
With tracing enabled, software engineers and SREs can pinpoint any issues within the chain of requests among the various involved services.
Where Jaeger fits into the tracing paradigm
What is Jaeger tracing?
Jaeger is an open-source tracing tool that allows engineers to track request performance and issues among 10s, 100s, and even 1000s of services and their dependencies. It collects tracing data and then populates Grafana dashboards.
The key benefit of this is that it highlights downtime/load-time risks and errors. This makes it an essential component of a strong observability practice.
Jaeger’s origin story
Jaeger was created in 2015 by an engineer at Uber, Yuri Shkuro, who wanted to help engineers work out where issues were popping up. This emerged as a critical need at Uber over time.
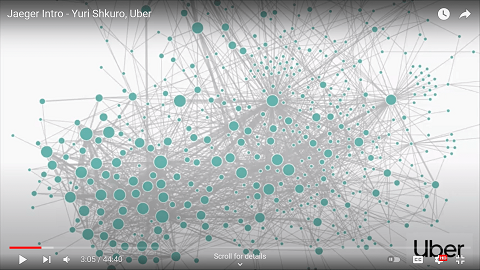
The Uber app may seem simple to its end users, but behind the facade runs a complex network of microservices. Many of these services depend on other services and their sub-services.
Weaknesses in the service chain can risk the whole user request falling apart i.e. no ride.
In business terms, Uber risks losing ride fares at a large scale if one or some component services fail or slow down.
“In deep distributed systems, finding what is broken and where is often more difficult than why“
— Yuri Skhuro, Founder & Maintainer, CNCF Jaeger
Jaeger tracing helps engineers find out what services are experiencing issues and where. That way, they can fix small issues before they snowball into serious problems or crises.
Do your observability needs justify using Jaeger?
You might be wondering whether you even need Jaeger. After all, your use case might not be as complex as Uber’s. Jaeger was designed to make sense of a complex web of services and up to millions of daily requests.
Tracing is not an absolute must-have for simpler software architectures. However, it is useful for finding bottlenecks if you have more than a handful of services. Having more than 10 services is a fair threshold of need.
Would the following situation ever pose a problem for your software? Your application has more than 10 services and suddenly gets a traffic spike. A large volume of requests has not been completed.
How will you find the culprit fast enough to fix the issue?
If this compels your need for tracing, let’s explore how Jaeger tracing works from a high-level view:
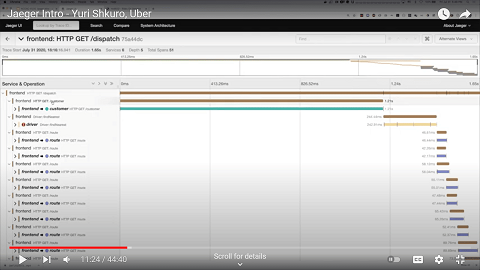
How Jaeger tracing works
Step 1

Jaeger Agent gathers “span data” by sampling parts of UDP packets transmitted by microservices
Step 2

Data (service name, start time, duration) gets sent on to the Collector
Step 3

Collector sends data to 2 places: Analytics and Visual Dashboard
Et voilà!
Now let’s explore how to install Jaeger on a Kubernetes cluster
How to setup Jaeger
2 ways to install Jaeger on Kubernetes
I will assume that you know how Kubernetes clusters are structured in terms of containers, nodes, pods, sidecars, etc.
Jaeger Agent can run on a Kubernetes cluster in two distinct ways: as a daemon or sidecar. Let’s compare both of them.
Setup Jaeger as a daemonset
Mechanism: Jaeger Agent runs as a pod and collects data from all other pods within the same node
Useful for: single tenant or non-production clusters
Benefits: lower memory overhead, more straightforward setup
Risk: security risk if deployed on a multi-tenant cluster
LEARN BY DOING: simple Jaeger setup tutorial via Digital Ocean
Setup Jaeger as a sidecar
Mechanism: Jaeger Agent runs as a container alongside the service container within every pod
Useful for: multi-tenant clusters, public cloud clusters
Benefits: granular control, higher security potential
Risk: more DevOps supervision required
LEARN BY DOING: deploy Jaeger as a sidecar via Jaeger’s Github
Remember from earlier that Jaeger samples parts of UDP packets transmitted by services?
There are 2 sampling methods for sampling UDP packets: heads-based sampling and tails-based sampling. Each has its benefits and downsides. Let’s explore:
Heads-based sampling
Also known as upfront sampling
Mechanism: sampling decision is made before request completion
Useful for: high-throughput use cases, looking at aggregated data
Benefits: cheaper sampling method – lower network and storage overhead
Risk: potential to miss outlier requests due to less than 100% sampling
Work required: easy setup, supported by Jaeger SDKs
Configuration notes: sampling based on flip-of-coin or until a certain rate is achieved
Tails-based sampling
Also known as response sampling
Mechanism: sampling decision is made after the request has been completed
Useful for: catching anomalies in latency, failed requests
Benefits: more intelligent approach to looking at request data
Risk: temporary storage for all traces – more infra overhead, a single node only
Work required: extra work – connect to a tool that supports tail-based sampling like Lightstep
Config notes: sampling based on latency criteria and tags
Now that you’ve picked your sampling method, you will also need to consider that Jaeger’s collector has a finite data capacity.
Prevent Jaeger’s collector from getting clogged
Jaeger’s collector holds data temporarily before it writes onto a database. The visual dashboard then queries this database. But the collector can get clogged if the database can’t write fast enough during high-traffic situations.
Problem:
- Collector’s temporary storage model becomes problematic during traffic spikes
- Some data gets dropped so the collector can stay afloat from the flood of incoming request data
- Your tracing may look patchy in areas because of the gaps in sampling data
- Risk of missing failed or problematic requests if they were in the sampling that gets dropped
Solution:
- Consider asynchronous span ingestion technique to solve this problem
- This means adding a few components between your collector and database:
- Apache Kafka – real-time data streaming at scale
- Apache Flink – processes Kafka data asynchronously
- 2 jaeger components – jaeger-ingester and jaeger-indexer – push Flink output to storage
Once these components are in place, the collector will be less likely to get overloaded and dump data.
Implementation reading:
These links – access them in order – might help you get started with your implementation:
Youtube – Jaeger straight-to-DB vs asynch write method
Youtube – Apache Kafka videos by Confluent
Practical overview (with example) of Apache Flink
Wrapping up
This concludes our article on Jaeger and the promise it holds for distributed tracing of microservices, as well as the wider observability apparatus.

- #34 From Cloud to Concrete: Should You Return to On-Prem? – March 26, 2024
- #33 Inside Google’s Data Center Design – March 19, 2024
- #32 Clarifying Platform Engineering’s Role (with Ajay Chankramath) – March 14, 2024