Episode 25 [SREpath Podcast]
Show notes
Tim Wheeler is not shy to skip past all-too-common platitudes and describe what it takes to build a solid developer experience and engineering culture.
Tim is the Director of Engineering Excellence at SquaredUp, which is in the observability dashboard space.
To him, DORA metrics are the supporting act for engineering excellence, not the headlining act.
If that term is not familiar to you, DORA metrics are a model designed to help improve engineering productivity. They were developed by DevOps thought leaders, Nicole Forsgren and Jez Humble.
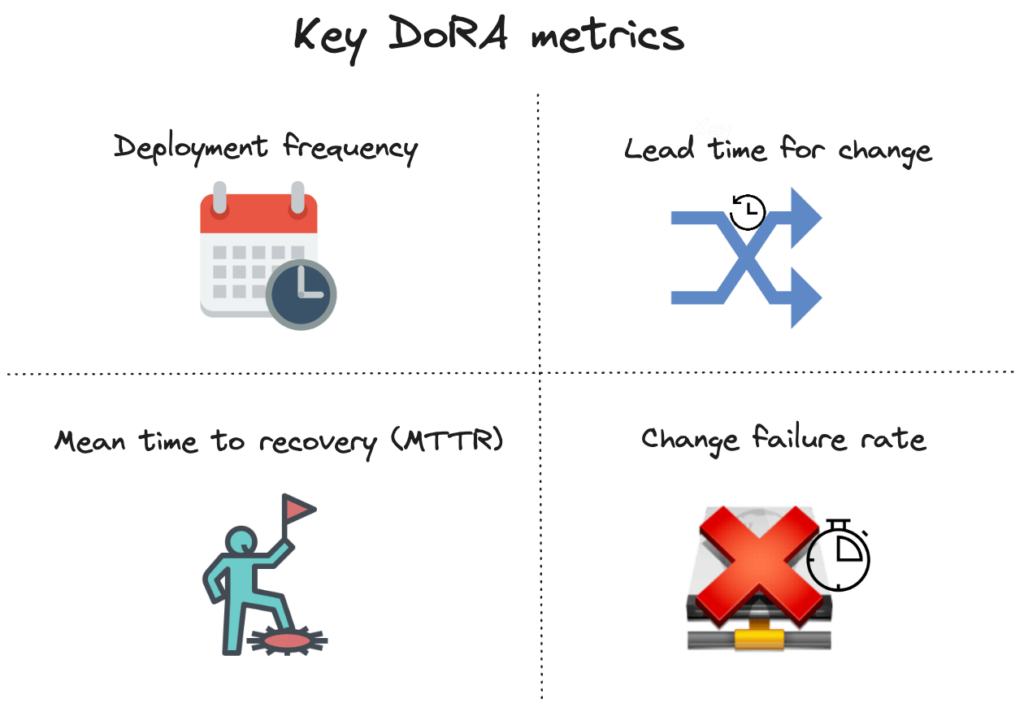
I’ve outlined the 4 key metrics of DORA below:
I developed a much stronger grounding on the concepts behind effective teams and culture from talking with Tim.
You also will benefit from our chat by picking up actionable tips on DORA metrics, handling team workloads, and more.
You can connect with Tim via LinkedIn
More about our conversation
This episode is very different from my usual about SRE. It’s a topic that spans an entire engineering organization, but funnily enough, it can affect SREs in a deep and meaningful way.
Remember that a large chunk of your time as an SRE should be spent on doing proactive work i.e. projects. That means engineering work, which just like developers have, is prone to being measured.
Tim has a strong maths and statistics background, which explains his prior career experience in software testing in banking and capital markets.
With all of this in mind, I feel assured that Tim has more than a fair grasp of DORA metrics and their impact on engineering performance (or excellence).
Our conversation touched on fascinating areas like:
➡️ How Tim uses a data mesh to gain insights on team health & performance
➡️ The need for a clear purpose behind the metrics you use to drive engineering work, to prevent metric sprawl
➡️ Avoiding perverse incentives that can arise from tying individual performance directly to metrics
Let’s unpack each of these:
Using data mesh to gain insights into team health & performance
Tim emphasizes the significance of data meshes in building comprehensive dashboards at SquaredUp.
It seems to me like they do this to bring together fragmented team data onto a singular dashboard.
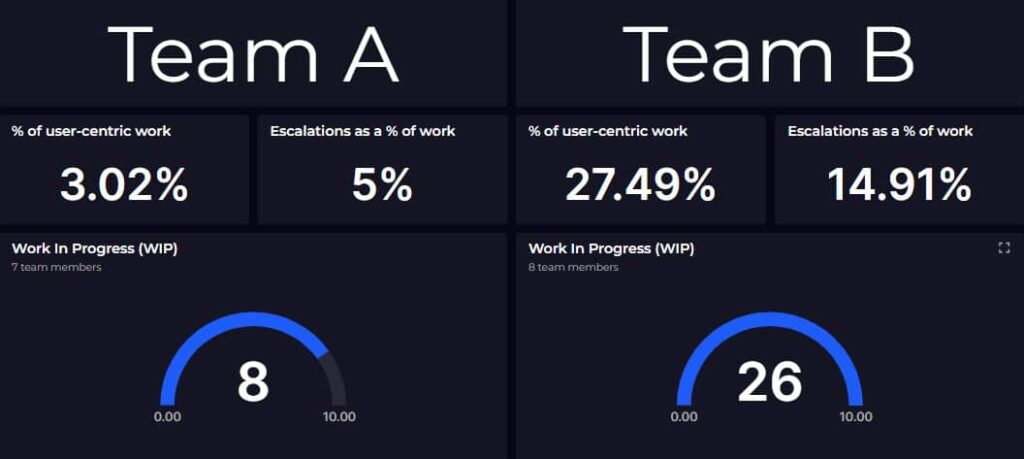
(click image to see Tim’s original post on LinkedIn)
Tim put it like this:
In terms of the tooling, we use what we call a data mesh to bring data from different sources to create a dashboard, but then we want to be able to roll it up so that at different levels within a company, you get the view that you need.
This makes a lot of sense because it enables different organizational levels to access tailored insights.
I like the idea because it can help:
- bust siloes among teams
- drive more transparency across the organization and
- support more informed decision-making
In a way, it’s a showcase of a pragmatic application of data meshes in an engineering context. A decentralized data architecture is not an easy task!
I think it’s an important goal for engineering leaders to create meaningful dashboards that truly reflect what’s going on across the organization with accurate data.
Having a clear purpose behind the metrics driving team performance
In our discussion, Tim emphasized the critical importance of a clear purpose behind every metric.
Rather than drowning in an excess of metrics, he advocates for a thoughtful selection, ensuring each metric serves a purpose and drives actionable insights.
Tim’s stance on this boils down to “If I can’t say what it’s for, just delete it.”.
Here’s a direct quote from our chat:
So a large part of what you do in terms of building these dashboards is actually having teams define their own status… What means that you’re healthy? What means that the team is on track and in a good place and what should be a warning… If I can’t say what it’s for, just delete it.
We spoke about the idea of having a balance between quantitative and qualitative data, steering away from overreliance on metrics alone.
This approach prevents “metric sprawl” and encourages meaningful conversations within teams.
All this underscores the need for metrics to align with the team’s goals. Only then can we foster a healthier work environment that steers teams and individuals clear of counterproductive incentives.
Avoiding perverse incentives from tying performance to metrics
Drawing from experience, Tim emphasizes that once people are aware of the metric determining their performance, it becomes counterproductive.
He stresses the potential misuse of metrics like deployment frequency, highlighting the risk of incentivizing speed over quality.
Here’s the quote:
One of the DORA metrics being deployment frequency can be a really misleading statistic. Because, yeah, give me the keys to the kingdom and let me just merge whatever I want. I can give you any deployment frequency you like. I can do it every minute, I can write the script. All metrics are open to abuse and can encourage the wrong behavior.
Instead, Tim advocates for a blend of metrics applied at a higher level, avoiding individual targeting.
He underscores the importance of combining quantitative and qualitative data.
The key here is to maintain a balance to prevent skewed behaviors. Only then can we ensure a holistic approach to performance evaluation.
In Episode #25 of the SREpath podcast, Tim tells us about DORA and the pursuit of engineering excellence [Spotify link]
I’m sure you will gain some interesting ideas to take back to your team about using DORA metrics better.
At the very least, you can take inspiration for a more generative engineering culture.

- #34 From Cloud to Concrete: Should You Return to On-Prem? – March 26, 2024
- #33 Inside Google’s Data Center Design – March 19, 2024
- #32 Clarifying Platform Engineering’s Role (with Ajay Chankramath) – March 14, 2024